SEO reporting dashboard: the report structure that actually works
A reporting dashboard is not a bigger version of the SEO monitoring dashboard you already check every morning — it is a different document, built for someone who reads it once a month and never touches the underlying data. If your current report is a Search Console export pasted into a slide, or a dashboard nobody outside your team ever opens, the fix is fewer numbers, not more.
Monitoring is something you do continuously, for yourself. Reporting is something you produce on a schedule, for an audience — a client who pays you, a manager who has to defend the SEO budget upward, or a board that sees the business in quarters, not daily sessions. That audience does not want raw KPIs in the form Search Console shows them. It wants a small number of decisions, defended with evidence.
Whatever term brought you here — an SEO dashboard, an SEO analytics dashboard, an SEO performance dashboard — the underlying problem is usually the same one. You are already tracking the numbers. What you need now is a repeatable way to turn that tracking into a document somebody outside your team can open and understand in two minutes.
This guide covers both halves of that problem: the structure a report needs to actually get read, and the tools that can build it, from a free Looker Studio connection to a purpose-built reporting layer. It does not cover choosing rank-tracking software or running a technical audit — those are different jobs, with different tools, and conflating them is how a reporting dashboard ends up promising data nobody involved can actually produce.
A monitoring view and a reporting document solve different problems
A monitoring dashboard is a live view: clicks, impressions, and position updating as Google’s data refreshes, open in a browser tab you glance at between other tasks. Nobody outside your team sees it, and it does not need to explain itself — you already know what a dip in week three meant.
A reporting dashboard is the opposite shape. It is a static snapshot, produced on a cadence — weekly, monthly, quarterly — and handed to somebody who was not watching the numbers move in real time. It has to carry its own context: what changed, why it likely changed, and what happens next. A client does not want to be handed the same live view you use internally; they want the three or four things that matter, explained once and then left alone until the next cycle.
This distinction is not academic. Building your reporting dashboard as a slightly-trimmed copy of your monitoring dashboard is the single most common way agency reports fail to get read: they carry the operator’s context but not the client’s, so every chart needs a live explanation that the document itself does not provide.
Recommended tools and products for the report
There are two honest routes to building the report itself, and the right one depends on how often you produce reports and how many clients or properties you are reporting on. Neither route requires you to invent numbers or borrow features a tool does not actually have — the recommendation below is scoped to what each option genuinely does.
The free route is Google Search Console’s own data, exported by hand or pulled into a Looker Studio SEO dashboard template. This works well at one property, reported occasionally, by someone comfortable rebuilding a chart when the connector breaks. It does not scale past a handful of clients, because every new property means rebuilding the connection and every scheduling change means you doing it manually — nobody is paid to maintain a Looker Studio template as their job, so it tends to be the first thing that goes stale when you get busy.
The paid route is a reporting layer that sits on top of Search Console and GA4, and turns the connection, the scheduling, and the branded export into something you configure once. SEO Gets is that kind of tool — it is a Search Console and GA4 wrapper, not an independent rank tracker or a crawler, so it is a strong fit specifically for reporting on the data those two platforms already give you, not for backlink or technical-audit reporting. Both of its paid plans are genuinely reporting products, not the same plan renamed twice: they differ in exactly what a growing reporting practice runs into first.
SEO Gets Core — Search Console and GA4 in one view
Core is the first paid tier, listed at $39 per month, and the thing it changes is
that search data and behaviour data stop living in two separate tabs. It connects
Google Analytics 4 alongside Search Console, then layers on the reports that are
tedious to reproduce by hand: striking distance, keyword cannibalization, and
content decay. The client-facing half is what most agencies actually buy it for —
live portals shared by link, scheduled reports that send themselves, and PNG
export carrying your own branding rather than a vendor logo.
What to check
Vendor: SEO Gets
Plan level: first paid tier, above the free plan and below Pro
Check before buying: whether you specifically need GA4 alongside Search
Console, whether anyone will actually open the client portals, and whether the
opportunity reports tell you something your current process does not
Who it suits
The reader who has outgrown exporting Search Console by hand every month but has
not yet hit the retention wall. That is usually a freelancer or a small agency
reporting on several client properties, where the saving is measured in hours per
client per month rather than in any single feature. Connected properties and team
seats are unlimited on every tier including Free, so this plan is not a way to buy
more capacity — it is a way to buy the reports and the client-facing output.
Be aware
History stays at 16 months on this tier, matching Search Console’s own limit, so
if the problem you are solving is a year-over-year comparison that already aged
out, this plan does not solve it. Index reporting for indexed pages is a Pro
capability and is not included here either. And the free plan is a genuinely
working Search Console dashboard, so the honest question before paying is whether
GA4, the client portals or the opportunity reports are worth $39 a month to you
specifically — not whether the paid tier is better in the abstract.
SEO Gets Pro — the tier that removes Search Console’s ceilings
Pro is listed at $49 per month and exists to lift the two limits that eventually
stop everyone: Google Search Console retains 16 months of performance data and
throttles its API, and no dashboard built on top of it can invent history the
source no longer holds. This tier retains up to five years, removes the Search
Console API request limit, and adds index reporting so the number of pages Google
actually has indexed becomes something you can watch move rather than something
you spot-check. It also introduces the Super Site concept, extended storage, and
content change tracking.
What to check
Vendor: SEO Gets
Plan level: top tier, above Core
Check before buying: how old the site is, how many properties genuinely need
long history, and whether anyone will act on index reporting once they have it
Who it suits
The reader whose reporting question is historical — year-over-year comparisons,
the shape of a site before and after a core update, or an argument that has to be
made with data older than Search Console keeps. It also suits anyone whose current
setup is already hitting Search Console API quota errors rather than row limits,
because removing that ceiling is a capability rather than a convenience.
Be aware
The extended history and index reporting apply to one Super Site, so a portfolio
of equally important properties is a different calculation than a single flagship
site, and it is worth doing that arithmetic before upgrading. Retention also only
runs forward: a plan bought today does not retroactively recover months that have
already aged out of Search Console, which is the single most common
misunderstanding about paying for retention. If the site is younger than 16
months, the headline feature has nothing to retain yet and Core is the honest
recommendation.
Neither plan is the only correct answer for everyone. If you manage a single site and report to yourself, Search Console’s free UI or a self-built white label SEO dashboard in Looker Studio may cover you indefinitely. If you report to five or more clients on a schedule, or a manager wants a portal they can check without asking you for the latest export, the point where a manual export stops being a good use of your time arrives fast — usually somewhere around the third recurring client.
Other paid tools solve overlapping but not identical problems. Semrush, Ahrefs, and SE Ranking add independent rank tracking and backlink data that Search Console does not carry at all — worth it if your report needs to show ranking positions your own tracker measured, not just Google’s average position. Whatagraph and similar cross-channel reporting platforms are built for combining SEO with paid media and social data in one client deck, which is a different job than a dashboard built specifically around Search Console and GA4.
The report structure guide: what belongs in each section
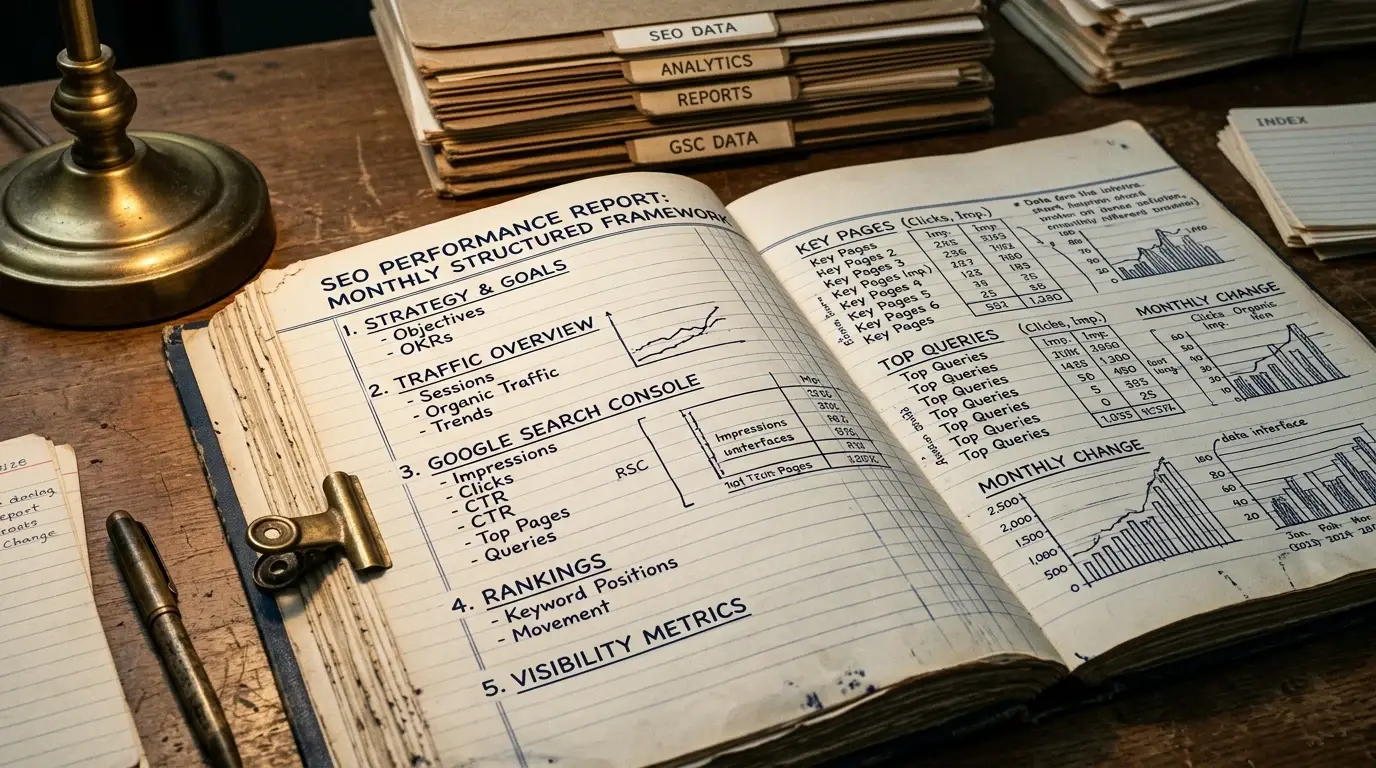
The report structure matters more than the tool that builds it. Most SEO reports fail not because the data is wrong, but because they are organized as a list of every metric the dashboard can show, in whatever order the tool exports them. A report that gets read has a fixed order, and each section has a job — this is the structure worth copying, in the order it should appear, whether you build it by hand in Looker Studio or generate it from a scheduled export.
Section
What belongs in it
What to leave out
Executive summary
The one-paragraph verdict: what happened, what it means, what you are doing next
Any chart. This section is text only
Traffic and visibility trend
Clicks and impressions over the reporting window, with the trend line, not just the endpoints
Session counts from GA4 with no organic filter applied
Keyword and query movement
The queries that moved most — up and down — and why, in plain language
Every tracked query. Ten to twenty rows, not a full export
Technical and indexing signals
Indexed-page counts and any coverage issues that changed
Backlink counts or crawl scores, unless a separate tool actually produced them
Appendix or raw data link
A link to the full export or live portal, for the reader who wants more
Nothing — this section exists so the rest of the report can stay short
Executive summary: the one paragraph that gets read
Most readers of a client report read this section and skim the rest. Write it last, after you know what the data actually shows, and write it as a verdict: what happened this period, in one sentence; why, in one sentence; what you are doing about it, in one sentence. Skip the chart here — the summary is the one place in the report that should be pure text.
Traffic and visibility trend
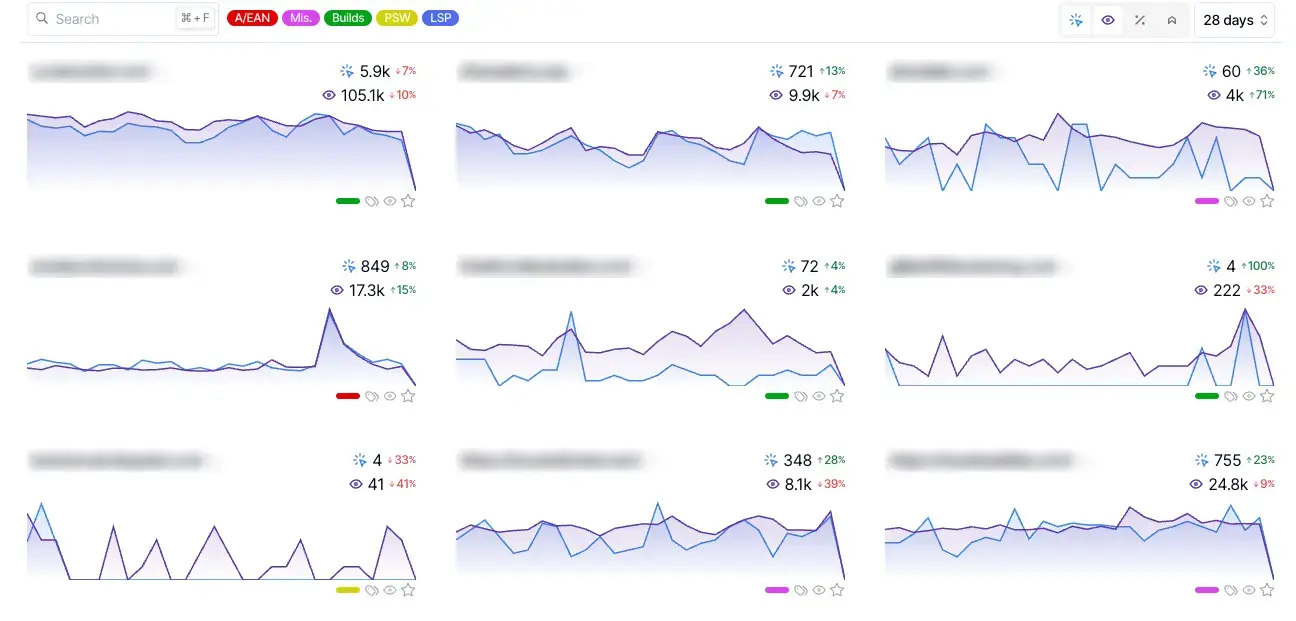
Show clicks and impressions over the full reporting window, not just this period against last period as two bare numbers. A trend line lets the reader see whether a drop is a blip or the start of a pattern, which two endpoints cannot show. If you report monthly, plot at least the trailing three to six months so a seasonal dip does not read as a crisis.
Keyword and query movement
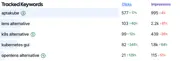
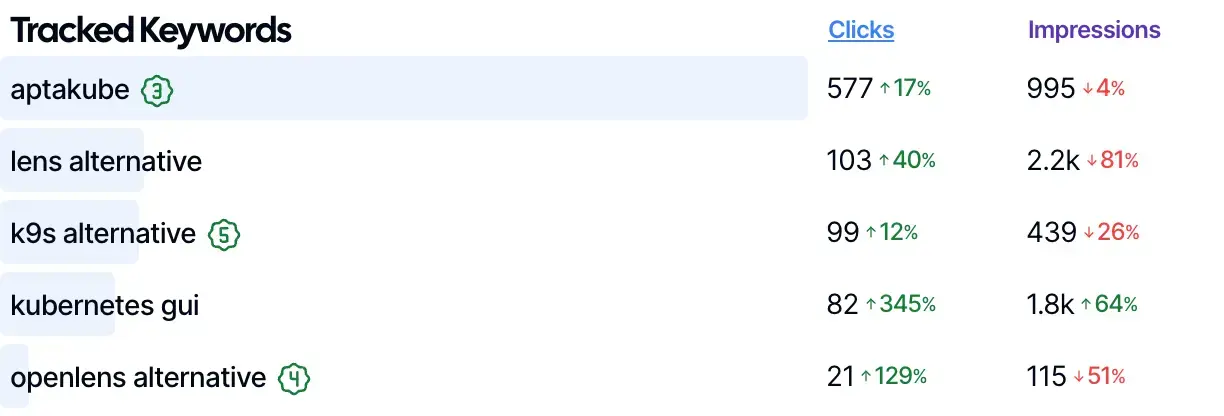
This is where a SEO report template earns its place: a short table of the queries that moved most, gaining or losing clicks, with a one-line note on why. Ten to twenty rows is a report; five hundred rows pasted from the Search Console UI export is an appendix nobody will read. If a query moved because of a known Google update, say so and link the update, not a vague “algorithm change.”
Technical and indexing signals — and their limit
Indexed-page counts, coverage issues, and anything that changed on the crawling and indexing side belong here when they are the story. Be precise about where this data can come from: Search Console’s own coverage reporting, or an indexing feature inside a Search Console wrapper like SEO Gets. Neither Search Console nor a wrapper built on it crawls your site independently or audits technical SEO the way a dedicated crawler does — do not present indexing counts as a substitute for a technical audit, and do not claim a backlink or site-health score you did not actually generate with a tool built to produce one.
What to leave out
The fastest way to lose a reader is a report that tries to be comprehensive. Total sessions with no organic filter, raw bounce rate, every ranking keyword regardless of volume, and any metric you cannot explain in one sentence should not make the report — put them in the linked appendix instead, where the minority of readers who want them can find them. A shorter report a client actually reads outperforms a complete one they skim past the first page.
Comparison: who should build which kind of report
Agency and freelance SEOs reporting to paying clients: the report is the product the client is paying to receive, so client-ready output — a live portal, a branded export, a fixed schedule — earns its cost the first month you stop assembling reports by hand. A white label SEO dashboard with your own branding, not the tool’s, is the detail that makes it read as your work rather than a forwarded vendor email. This reader has the highest willingness to pay of the three, because the report itself is billable.
In-house SEO and marketing leads reporting to a manager: you need one recurring view across properties that survives being forwarded without you in the thread, and a report your manager can defend upward without calling you to explain a chart. A scheduled export or a shared portal beats a live dashboard link a manager has to be taught to read, and it should lead with the executive summary, not a wall of query-level detail nobody above you asked for.
Site owners and solo operators reporting to themselves: you probably do not need a reporting dashboard yet. Search Console’s own performance report, checked on your own schedule, covers this until you are reporting to somebody else — see our roundup of best SEO monitoring tools for what actually earns a subscription at this stage, which for most solo operators at this point is nothing at all.
Practical tips for shipping the report on schedule
Pick a cadence and keep it. Monthly is the default for most client relationships; weekly only if the account is large enough to justify the extra attention, and quarterly for board-level audiences who think in bigger windows than a month.
Know your Search Console history limit before you promise a year-over-year chart.Google’s own documentation confirms the Search Console UI and standard API access retain sixteen months of performance data — not enough for a true year-over-year comparison in month thirteen onward. If your reporting depends on longer history, that is a documented limit a free export cannot get around, and one reason a tool that separately retains longer history exists.
Export past the 1,000-row UI cap when the report needs more than headline numbers. The Search Console UI table tops out at 1,000 rows, but Google’s own Search Analytics API reference documents pulls of up to 25,000 rows per request — see our Search Console API guide for how to set that up without writing the query yourself.
Automate the send, not just the pull. A report that depends on you remembering to export and email it monthly will eventually be late; a scheduled export or portal link removes that failure point entirely.
Annotate, don’t just chart. A drop that lines up with a known Google ranking update reads as expected; the same drop with no annotation reads as a problem you missed. Note major dates directly against the trend line.
If your data lives in BigQuery, say so and link to it. Teams already pulling Search Console data into a warehouse for custom analysis should read our Google Search Console BigQuery export guide before building a parallel manual export — you likely do not need both.
Keep the same report structure every cycle. A reader who gets a differently organized document each month has to relearn it before they can trust it. Change the numbers, not the order of sections — consistency is what lets a client skim the executive summary and trust that nothing important moved further down.
Version and archive what you send. Keep a dated copy of every report you deliver, even a simple export. When a client asks in month nine why a metric changed since month three, having the actual document you sent beats reconstructing the number from a live dashboard that has since moved on.
Frequently asked questions
What is the difference between an SEO monitoring dashboard and an SEO reporting dashboard?
A monitoring dashboard is a continuously updating internal view you check yourself; see our SEO monitoring dashboard guide for what belongs in that view. A reporting dashboard is a periodic, self-contained document built for someone who was not watching the numbers move — a client, a manager, or a board.
How often should I send an SEO report?
Monthly is standard for most client and management relationships, since SEO trends rarely tell a meaningful story week over week. Larger accounts or active campaigns can justify weekly updates; board-level or annual-budget audiences are often better served quarterly.
Can I build an SEO reporting dashboard for free?
Yes, at small scale. A Looker Studio SEO dashboard connected to Search Console covers one or two properties reported occasionally, at no cost beyond your time rebuilding the connector when it breaks. It stops scaling once you are reporting to several clients on a fixed schedule.
How much Search Console history can a report actually show?
Search Console’s standard performance data goes back sixteen months, whether you are viewing it in the UI or pulling it through the API. A report that needs longer trend history requires a tool that separately retains data beyond that window, since Search Console itself does not.
What should I leave out of a client SEO report?
Any metric you cannot explain in one sentence, unfiltered total sessions, a full keyword export instead of the ten to twenty queries that actually moved, and any chart repeated from your internal monitoring view without being reframed for someone who was not watching it happen.
Do I need GA4 data in an SEO report, or is Search Console enough?
Search Console alone answers what people searched and clicked; GA4 answers what those visitors did once they landed. A report that only covers acquisition without any behavior data is common and defensible for a pure visibility report, but claiming conversion impact requires the GA4 side too.
Is SEO Gets the same thing as Looker Studio?
No. Looker Studio is a free, general-purpose chart builder you connect to Search Console yourself and rebuild by hand whenever the connector breaks or a client needs a new view. SEO Gets is a purpose-built Search Console and GA4 wrapper with scheduled delivery, client portals, and branded export already built in — the tradeoff is a monthly subscription in exchange for not maintaining the connection yourself. Neither is a like-for-like swap for the other: pick Looker Studio when you are comfortable rebuilding, and a wrapper like SEO Gets when your time is worth more than the subscription.
Reporting and monitoring solve different jobs, and treating them as the same dashboard is the most common reason a report goes unread. Start from the SEO monitoring dashboard if you need the continuous internal view; come back here for the document you actually send. For the metrics worth including, see our guide to SEO KPIs; for a ready structure to copy, see our SEO report template. If your reporting needs are technical-audit adjacent rather than performance-data adjacent, our Google Search Console SEO audit guide covers what Search Console’s own coverage data can and cannot tell you.