SEO report template: every section, filled in and ready to copy
An SEO report is a periodic document that turns raw search performance data into a decision someone else can act on — clicks and rankings alone don’t do that; the write-up around them does. Below is the full structure, section by section, with the exact field a writer fills in and a real sentence showing what belongs there. You won’t need to trade an email address for it — it’s all on this page, and you can start filling it in today. If you’re deciding how often to send this, that’s a separate question our client reporting guide covers; if you’re deciding which numbers earn a place in it, see SEO KPIs.
The template, section by section: a copy-and-paste guide
A report built for a client or a manager needs more structure than a personal monitoring dashboard does, because nobody reading it has your context. Each section below exists to answer one question the reader would otherwise have to ask you directly. Copy the table headers, swap the sample text for your own numbers, and the report is functionally done.
Cover and report basics
The reader should know what they’re looking at and for whom before reading a single metric — this section prevents “wait, is this report from this month or last month?” follow-up emails.
Field
What goes here
Client or site name
The property this report covers, matched to how the client refers to it internally
Reporting period
Exact start and end dates, not “last month”
Prepared by
Your name or agency, plus a contact for questions
Date sent
The send date, separate from the reporting period
Example: “Monthly SEO performance report for Northside Dental, covering July 1 through July 31, 2026. Prepared by Riverside Digital. Questions: hello@riversidedigital.example.”
Executive summary
Write this section last, even though it appears first — you can’t summarize a report you haven’t built yet. A busy reader should get the whole story from this section alone, in under a minute.
Field
What goes here
Headline number
The single metric that best represents the period, with its change
Direction
Whether the trend is improving, flat, or declining, stated plainly
Cause
The most likely driver, stated as a hypothesis, not a fact you weren’t there to observe
What’s next
The one action this report is building toward
Example: “Organic sessions grew 14% month-over-month to 22,400, driven mainly by branded search after the homepage refresh in early July. Non-branded traffic was flat, which is this quarter’s focus — see recommendations below.”
Traffic and visibility overview
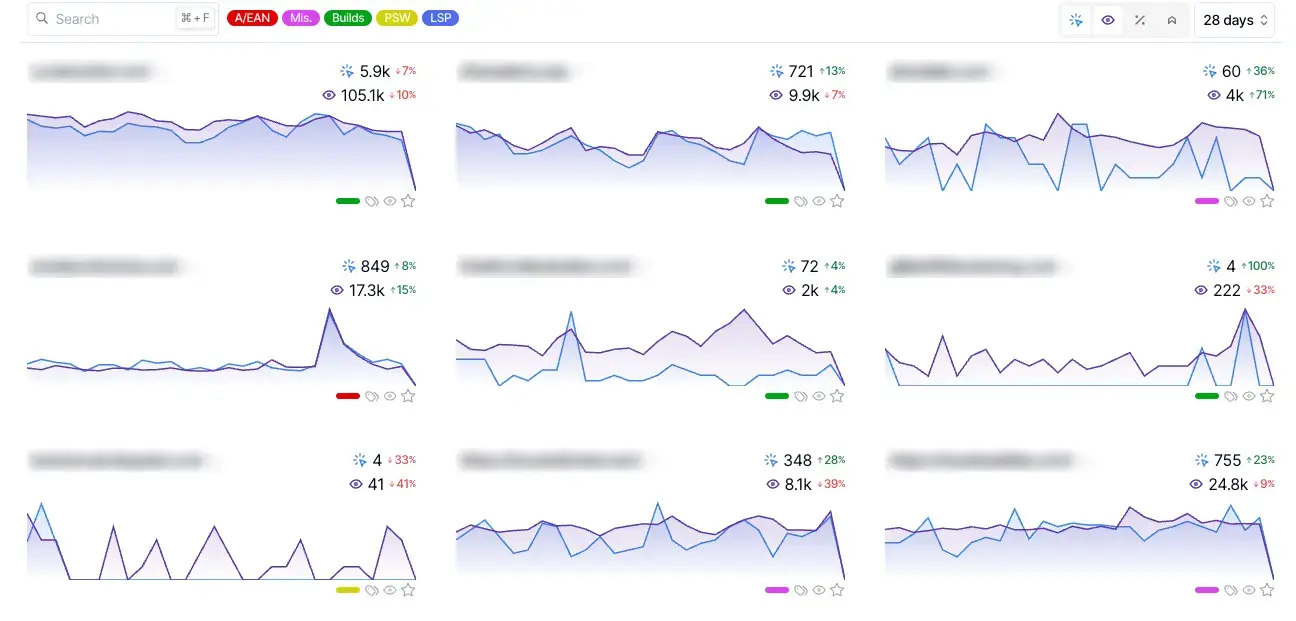
This is the trend section: a time-series view that shows whether the property is moving in the right direction before the reader looks at any individual metric.
Field
What goes here
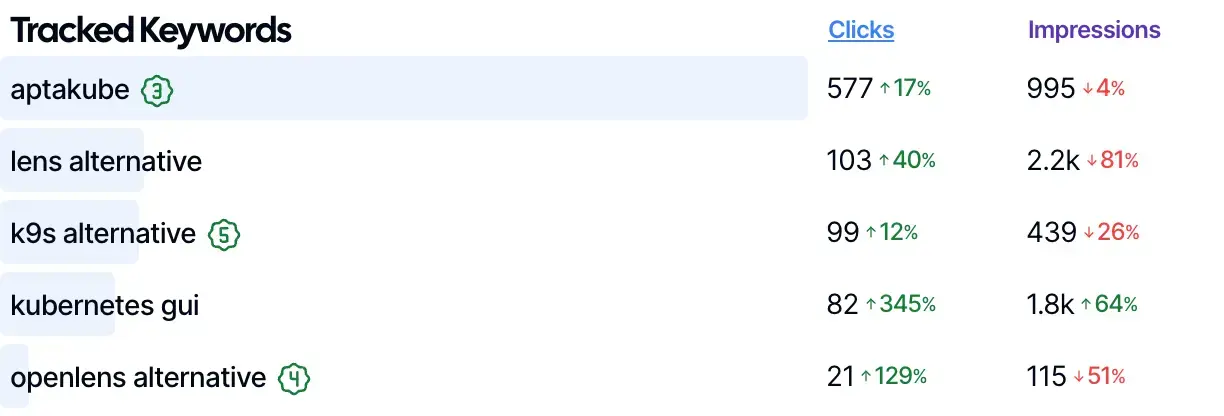
Clicks
Organic clicks for the period versus the prior period
Impressions
How often the site appeared in search results
Average CTR
Click-through rate, and whether it moved independently of position
Average position
Google’s own average ranking position across tracked queries
Example: “Clicks rose from 4,180 to 4,760 (+13.9%) while impressions were nearly flat (+2.1%), meaning the gain came from better click-through rate, not more visibility — worth a look at whether recent title tag changes are the cause.”
Pull these four numbers straight from Search Console’s own Performance report; if you’re building the report by hand every month rather than pulling from an automated source, our guide to the Search Console API covers getting past the UI’s 1,000-row cap when a site has more queries than that.
Keyword and ranking performance
The reader wants to know which specific queries moved, not just that “rankings improved” in the abstract.
Field
What goes here
Query or keyword group
The term or cluster of terms being reported
Position change
Current average position versus the prior period
Clicks and impressions
Volume behind the position, so a rank change reads in context
Notes
Anything that explains the movement — a new page, a competitor change, a core update
Example: “‘Emergency dentist [city]’ moved from position 8.2 to position 5.6 after the new landing page went live June 14; clicks on that query rose from 22 to 61.”
Google’s own average-position figure is not a rank tracker’s daily snapshot — it’s an average across every impression in the date range — so don’t present it as though it were a keyword-tool ranking history. If a client specifically wants daily rank tracking, that’s a job for a dedicated tool, not this report; our best SEO monitoring tools guide compares where that line sits.
Top page and content performance
This section answers “which pages are actually working,” which is a different question from “is the site working.”
Field
What goes here
Top pages by clicks
The pages driving the most organic clicks this period
New or notably changed pages
Anything published or substantially edited during the period
Underperforming pages
Pages that lost clicks or impressions, worth a flag even without a fix yet
Content gaps
Topics competitors rank for that this site doesn’t have a page for
Example: “/services/root-canal/ remained the top page (1,120 clicks, +6%). The new /services/same-day-crowns/ page, published July 8, brought in 340 clicks in its first three weeks.”
If this section is the part a reader keeps coming back to between reports, that’s a signal they want a live view rather than a periodic one — our Looker Studio dashboard guide covers building that as a companion to, not a replacement for, this document.
Technical and indexing health
Not every report needs a full crawl, but every report needs an honest read on whether Google can actually find and serve the site’s pages.
Field
What goes here
Indexed pages
Pages Google has indexed versus total pages that should be
Coverage issues
Errors or warnings from Search Console’s Index Coverage / Pages report
Core Web Vitals status
Pass, needs improvement, or fail, at a summary level
Mobile usability
Any flagged mobile issues, if present
Example: “212 of 218 eligible pages are indexed. Six are excluded for ‘crawled — currently not indexed,’ most of them thin category pages from the old site structure that predate this engagement.”
A monthly report is a poor place to surface a technical audit’s full detail — if the client needs that depth, hand them a proper SEO audit instead of trying to compress a crawl report into three table rows.
Backlink and off-page summary
Neither Search Console nor SEO Gets carries backlink data, and this is worth stating plainly rather than skipping the row and hoping nobody asks. If backlinks matter to the engagement, this row’s source is a separate tool with its own index — Ahrefs, Semrush, or a similar backlink crawler — cited by name so the reader knows where the number came from.
Field
What goes here
New referring domains
Net new domains linking to the site this period
Notable links
Any specific placement worth calling out by name
Source
Which tool the backlink figures came from
Lost links
Any significant links that disappeared, if tracked
Example: “Referring domains rose from 84 to 91 (source: Ahrefs, pulled July 31). The Chamber of Commerce directory listing renewed after last month’s outreach.”
Conversions and business impact
This is the section that connects search performance to the number a business owner actually cares about, and it’s the one most templates leave thinnest.
Field
What goes here
Organic conversions
Goal completions or key events attributed to organic traffic, from GA4
Conversion rate
Organic conversion rate versus other channels, for context
Revenue or lead value
Dollar value if e-commerce, or lead count if a services business
ROI note
A plain-language read on whether the spend is paying back, without overstating certainty
Example: “Organic drove 38 booking-form submissions in July, up from 29, at a 0.8% conversion rate against a site-wide average of 0.6%. At the practice’s stated $310 average patient value, that’s approximately $2,790 in incremental attributed value this month.”
GA4’s own data retention setting is worth a mention if a client asks why a comparison further back than expected came up empty — GA4 lets an account configure event-level retention up to 14 months, shorter than Search Console’s 16, and a report pulling both sources inherits whichever window is narrower.
Recommendations and next steps
A report that ends on data without a recommendation puts the reader in the position of having to figure out what to do with it themselves, which is the job they hired someone to do for them.
Field
What goes here
Priority action
The single highest-leverage thing to do next, stated as an action, not a metric
Reasoning
Why this action, tied back to a specific finding above
Owner
Who does it — you, the client, a developer
Timeline
When it should be done by
Example: “Priority: rewrite the title tag and add FAQ schema to /services/invisalign/, which lost 18% of impressions after a competitor page overtook it in June. Owner: agency. Timeline: before next report.”
Comparison: adapting the template per client
The nine sections above are a full report; not every reader needs every one, every time, and forcing all of them into a report for a reader who won’t use them just adds pages nobody opens.
E-commerce clients want the conversions section expanded with product-level detail and de-emphasize the technical health section unless there’s an active crawl issue — revenue per category matters more here than indexing counts.
Local and single-location businesses care most about the top-page and conversions sections, since their query set is narrow and the executive summary can often stand in for most of the report on its own.
Multi-location and franchise accounts need the keyword and ranking section broken out by location, which turns one report into several unless you build the template to filter cleanly by page or URL group.
SaaS and content-led sites lean on the content performance and keyword sections hardest, with conversions defined as trial signups or demo requests rather than purchases.
In-house teams reporting to a manager usually want the report shorter and the technical section merged into the executive summary — a manager rarely reads past the first screen.
Agencies reporting to a client who pays for the work want every section kept, because the report itself is part of what’s being paid for, alongside the cadence and format decisions that go with recurring client communication.
None of this changes what belongs in each section — it changes which sections get a full table and which get folded into a single line in the executive summary.
Automating the template so you’re not filling it in by hand
Everything above works as a manual document: pull the numbers from Search Console and GA4, paste them into a spreadsheet or a Google Docs table, and send it. That’s a completely legitimate way to run this template for a single site, checked monthly, by someone comfortable rebuilding the export each time.
Where a manual export stops being enough is specific and worth naming rather than implied. Google Search Console retains 16 months of performance history in both the UI and its standard export; anything older simply isn’t there to paste into a report, no matter how the template is built. The UI’s own Performance table caps at 1,000 rows, though the Search Analytics API returns up to 25,000 rows per request — fine for a single-location report either way, and quietly incomplete for a site with a long keyword tail if you’re stuck pasting from the UI table alone. And Search Console has no native scheduling — every monthly report is a manual pull, every month, for every property, unless something automates it on your behalf.
Three specific gaps in this template are where a manual monthly export runs out:
Scheduled delivery. Nothing in Search Console or GA4 sends this report on a recurring date; that has to be built or done by hand every period.
Branded, client-ready export. A raw data pull isn’t a document a client opens with confidence — it needs your own name and logo on it, not Google’s.
History past 16 months. A year-over-year section in this template — “up 22% versus the same month last year” — requires data Search Console itself no longer holds once that window closes.
SEO Gets Core — Search Console and GA4 in one view
Core is the first paid tier, listed at $39 per month, and the thing it changes is
that search data and behaviour data stop living in two separate tabs. It connects
Google Analytics 4 alongside Search Console, then layers on the reports that are
tedious to reproduce by hand: striking distance, keyword cannibalization, and
content decay. The client-facing half is what most agencies actually buy it for —
live portals shared by link, scheduled reports that send themselves, and PNG
export carrying your own branding rather than a vendor logo.
What to check
Vendor: SEO Gets
Plan level: first paid tier, above the free plan and below Pro
Check before buying: whether you specifically need GA4 alongside Search
Console, whether anyone will actually open the client portals, and whether the
opportunity reports tell you something your current process does not
Who it suits
The reader who has outgrown exporting Search Console by hand every month but has
not yet hit the retention wall. That is usually a freelancer or a small agency
reporting on several client properties, where the saving is measured in hours per
client per month rather than in any single feature. Connected properties and team
seats are unlimited on every tier including Free, so this plan is not a way to buy
more capacity — it is a way to buy the reports and the client-facing output.
Be aware
History stays at 16 months on this tier, matching Search Console’s own limit, so
if the problem you are solving is a year-over-year comparison that already aged
out, this plan does not solve it. Index reporting for indexed pages is a Pro
capability and is not included here either. And the free plan is a genuinely
working Search Console dashboard, so the honest question before paying is whether
GA4, the client portals or the opportunity reports are worth $39 a month to you
specifically — not whether the paid tier is better in the abstract.
SEO Gets Pro — the tier that removes Search Console’s ceilings
Pro is listed at $49 per month and exists to lift the two limits that eventually
stop everyone: Google Search Console retains 16 months of performance data and
throttles its API, and no dashboard built on top of it can invent history the
source no longer holds. This tier retains up to five years, removes the Search
Console API request limit, and adds index reporting so the number of pages Google
actually has indexed becomes something you can watch move rather than something
you spot-check. It also introduces the Super Site concept, extended storage, and
content change tracking.
What to check
Vendor: SEO Gets
Plan level: top tier, above Core
Check before buying: how old the site is, how many properties genuinely need
long history, and whether anyone will act on index reporting once they have it
Who it suits
The reader whose reporting question is historical — year-over-year comparisons,
the shape of a site before and after a core update, or an argument that has to be
made with data older than Search Console keeps. It also suits anyone whose current
setup is already hitting Search Console API quota errors rather than row limits,
because removing that ceiling is a capability rather than a convenience.
Be aware
The extended history and index reporting apply to one Super Site, so a portfolio
of equally important properties is a different calculation than a single flagship
site, and it is worth doing that arithmetic before upgrading. Retention also only
runs forward: a plan bought today does not retroactively recover months that have
already aged out of Search Console, which is the single most common
misunderstanding about paying for retention. If the site is younger than 16
months, the headline feature has nothing to retain yet and Core is the honest
recommendation.
Core covers the first two gaps directly: scheduled reports and branded PNG export sit on that tier, alongside live client portals if you’d rather send a link than a file. Pro is the tier built for the third gap specifically — it retains up to five years of history on one connected Super Site, so the year-over-year line in the executive summary above is something you can actually write, not just aspire to. Neither tier replaces this template; they remove the manual work of filling it in and sending it on a schedule.
If a single site, checked occasionally, is all you’re reporting on, none of this is necessary — a spreadsheet and a recurring calendar reminder cover that case fully, and a free Looker Studio dashboard is a reasonable middle step before paying for anything.
Practical tips for using this template
Fill in the executive summary last, every time. Writing it first means summarizing a report you haven’t finished, and it shows in vague language like “performance was mixed.”
Keep the recommendations section to one priority action, not five. A list of five things reads as a list nobody will do; one clearly reasoned action reads as a plan.
Date every reporting period explicitly. “This month” in a document that gets reopened eight months later is meaningless without a stated start and end date.
Note the data source next to any figure that didn’t come from Search Console or GA4. Backlink counts, rank-tracker positions, and conversion values from a CRM all need a named source so a reader can trace a number back to where it came from.
Annotate anything that lines up with a known algorithm change. A traffic dip that coincides with a documented Google update reads as expected context; the same dip with no note reads as something you missed.
Warehouse data before the 16-month window closes, if year-over-year comparisons matter to a client relationship — our Search Console BigQuery export guide covers the upstream fix.
Reuse the table structure, not the numbers. The fastest way to lose a client’s trust is a report that still has last month’s figures in a section nobody remembered to update.
Frequently asked questions
What should an SEO report actually include?
At minimum: a summary, a traffic and visibility overview, keyword or ranking movement, top-page performance, and a recommendation. The technical health, backlink, and conversion sections above are common additions, and which ones earn a place depends on what the client is actually paying to know.
How long should an SEO report be?
Short enough that the executive summary alone tells the full story, with the detailed sections available for anyone who wants to go deeper. A report that reads as ten dense pages every time is a report most recipients skim once and then stop opening.
What’s the difference between an SEO report and an SEO dashboard?
A report is a periodic, written document built for a specific audience and a specific period, with interpretation attached to the numbers. A dashboard is a live, always-current view meant to be checked, not read start to finish. Most engagements need both — see the difference in practice in our SEO reporting dashboard guide.
How do I automate a monthly SEO report?
Search Console and GA4 have no native scheduling for a formatted report, so automating this template means either building a Looker Studio report with a scheduled email delivery, or using a tool built specifically for scheduled, branded SEO reporting rather than assembling the pipeline yourself.
Can I build this template for free in Google Sheets or Looker Studio?
Yes, entirely. Pull the numbers from Search Console’s own export and GA4’s reporting UI, and either format is a legitimate home for this template at no cost — the tradeoff is your own time rebuilding the pull and the export every reporting period, and losing anything past Search Console’s 16-month retention window without a separate export step.
How far back can an SEO report show historical data?
Search Console itself retains 16 months of performance data, in the UI and through its standard API alike — a report built directly from that source cannot show a trend older than 16 months no matter how it’s formatted, unless the data was warehoused or retained separately before it aged out.
Should backlinks always be part of an SEO report?
Only when off-page work is part of the engagement. Neither Search Console nor GA4 carries backlink data, so including this section means pulling from a separate tool and naming that source in the report — leaving it out entirely is the honest choice when link building isn’t part of the work being reported on.
This template is deliberately complete rather than minimal — trim sections to fit the client and the reader, not the other way around. Start with SEO KPIs if you’re still deciding which numbers deserve a row in the executive summary, and see our client reporting guide for how often to send this and what to say around it. If the report is starting to matter more than the live dashboard behind it, our SEO reporting dashboard and best SEO monitoring tools guides cover what to build next, and the SEO monitoring dashboard guide is the place to start if none of this is built yet.